Can we predict a person's glucose levels based on their age?
If one thing depends on another thing in a linear way the least squares method can be used to predict the dependent thing (y) given the independent thing (x).
If there is a linear relationship between glucose levels and age we should be able to summarize that relationship using an equation of the form y = mx + b.
In this formula y would be the (predicted) thing (glucose level) and x would be the given thing (the person's age).
In this formula m is the slope of the linear relationship (weight) and b is the y-intercept constant (bias).
If a linear relationship exists and we can collect enough data we should be able to calculate the value of m and b and to predict the value of a person's glucose levels based on their age.
This youtube video explains how we can calculate the slope and y-intercept values by hand using the least squares method.
As an exercise I wanted to use Excel and machine learning to calculate the line of best fit.
Excel has built in "slope()" and "intercept()" functions that can be used to calculate the slope (m) and y-intercept (b) for a set of dependent and independent data points.
The youtube video referenced above explains how these functions work.
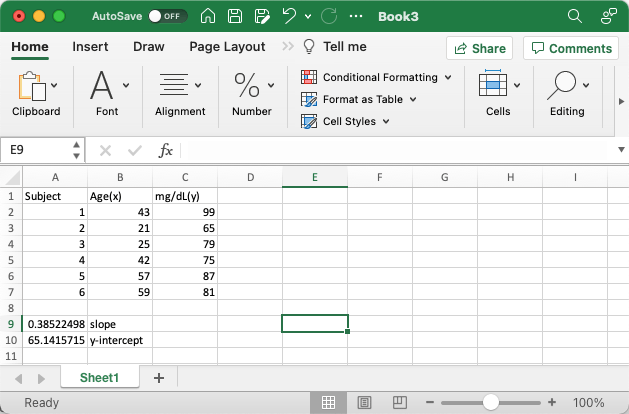
slope and y-intercept calculated by Excel
A Colab Notepad can be used to show data points and the line of best fit.
Predicting a person's glucose levels based on their age.
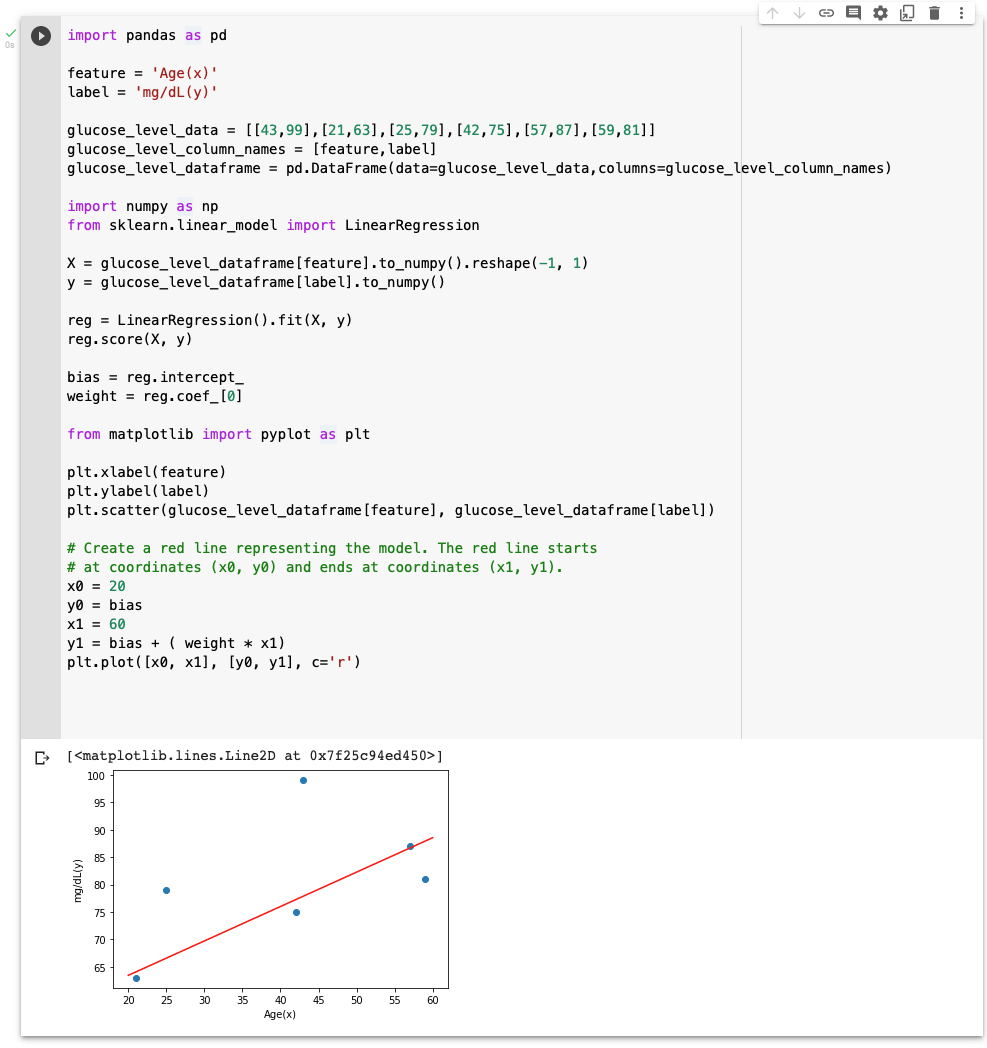
A scatter plot of the glucose level data with a line of best fit added in red ('r')
Once a model has been trained it can be used to make predictions.
In the example above we can provide a person's age and predict what their glucose level might be (based on the data used to train the model).

What would we expect a person's glucose level to be if they were aged 50?
Plotly Sample Datasets includes a larger diabetes dataset.
A Colab Notepad can used to show data points from the dataset and a description of the dataset.
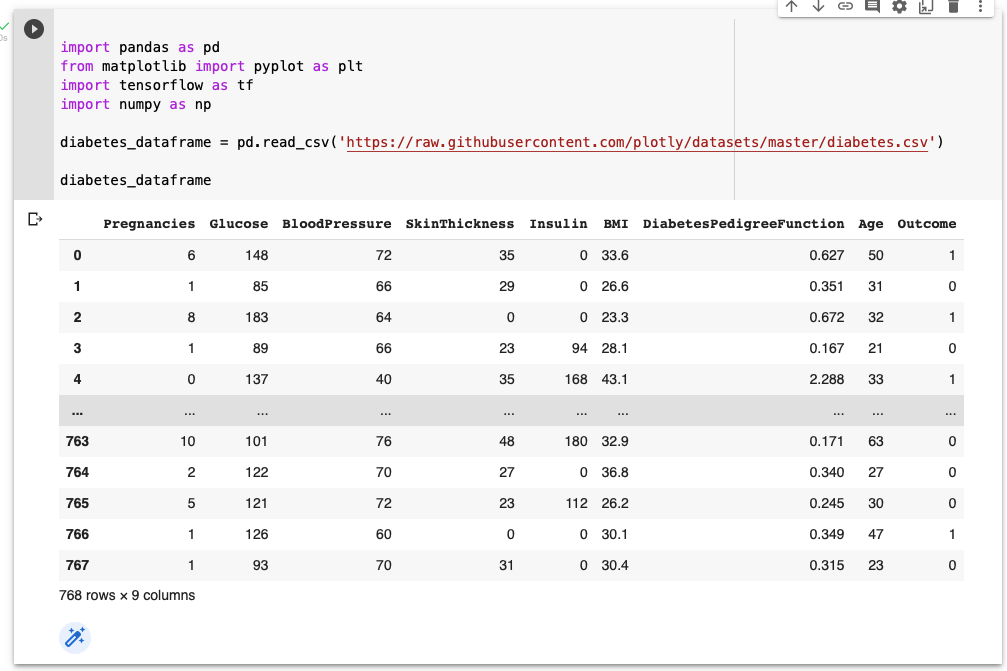
Diabetes Dataset
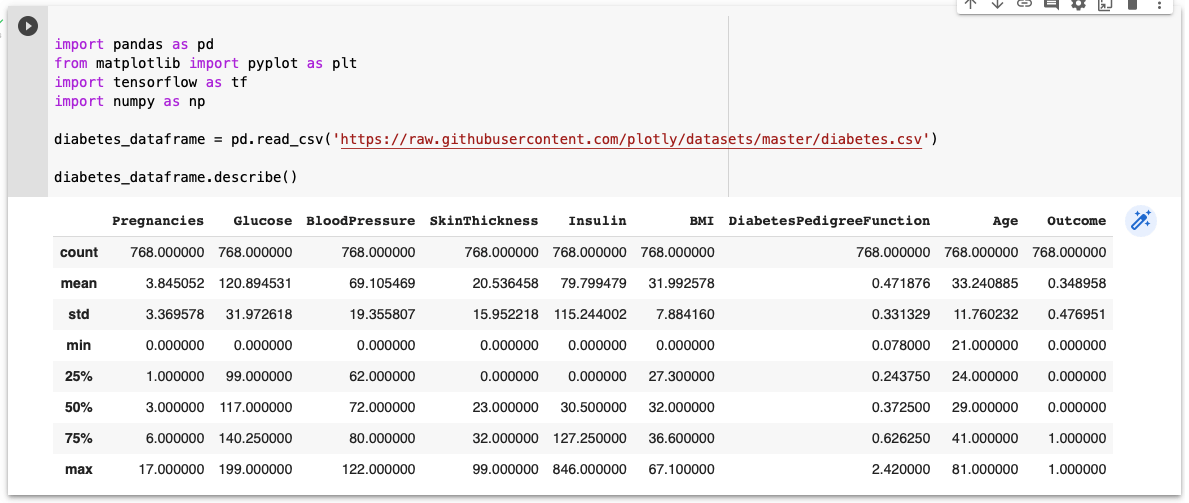
Description of Diabetes Dataset
Again we can use Excel to calculate a line of best fit.
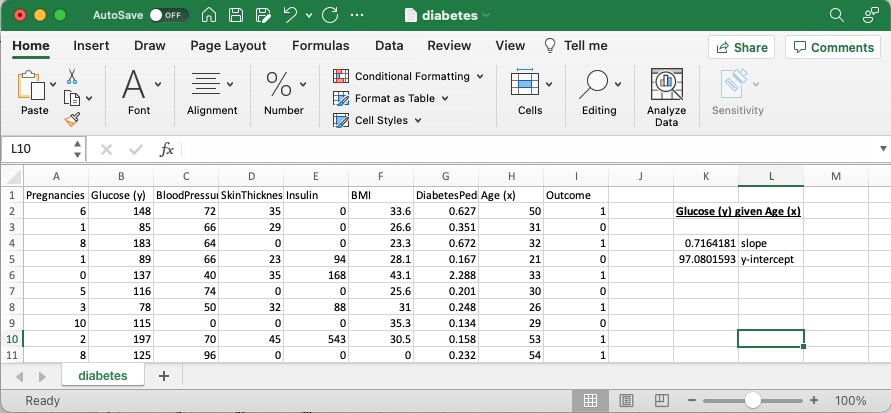
Using Excel to calculate the line of best fit for Glucose (y) given Age (x)
A Colab Notepad can be used to show data points and the line of best fit.
Predicting a person's glucose levels based on their age.
A scatter plot of the glucose level and age data with a line of best fit added in red ('r')
Predicting a person's glucose levels based on their age and BMI.
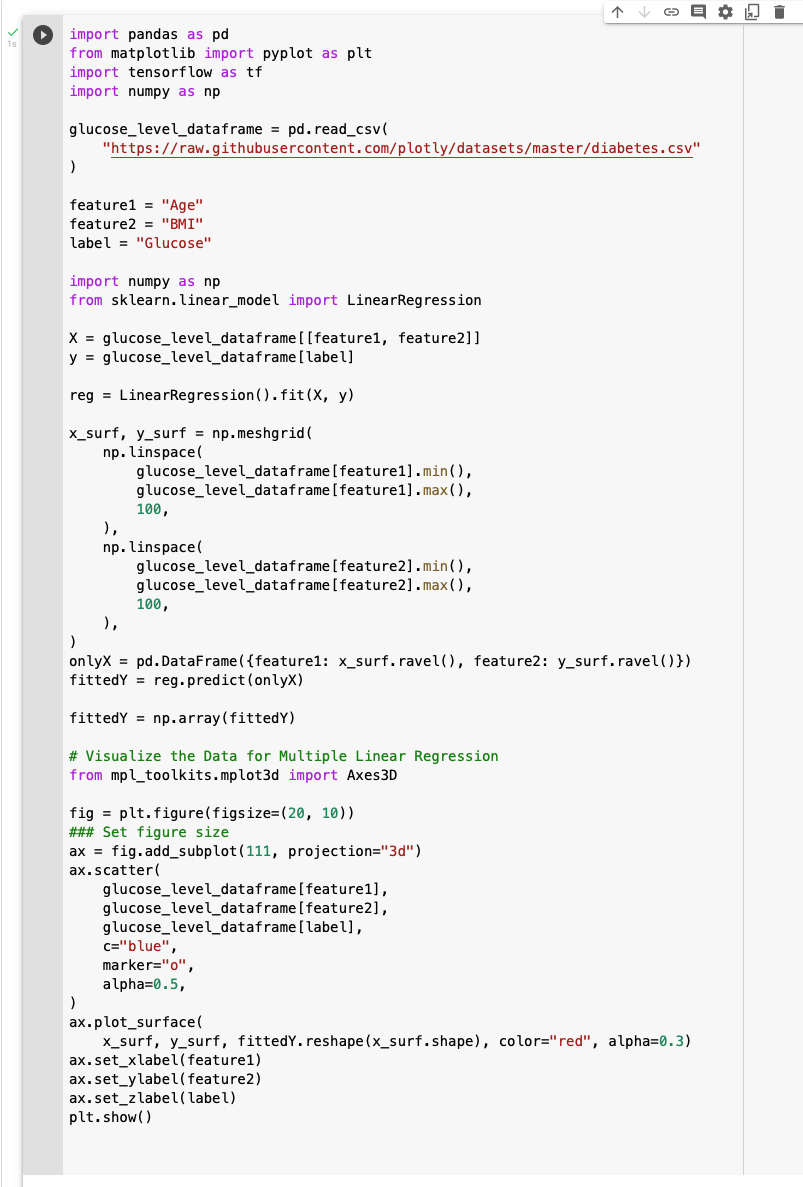
Predicting a person's glucose levels based on their age and BMI
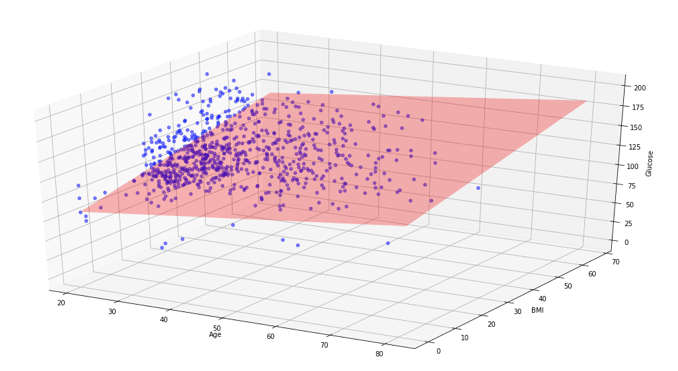
3D scatter plot of the glucose level, age and BMI data with the of best fit (surface) added in red ('red')
Once a model has been trained it can be used to make predictions.
In the example above we can provide a person's age and BMI and predict what their glucose level might be (based on the data used to train the model).
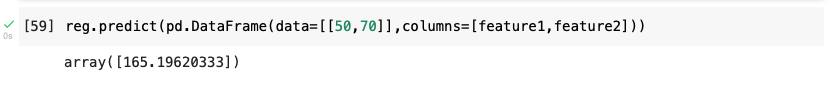
What would we expect a person's glucose level to be if they were aged 50 with a BMI of 70?