Leaflet
Neil Haddley • February 21, 2022
An open-source JavaScript libraryfor mobile-friendly interactive maps
Leaflet is an open-source Geographic Information System (GIS) JavaScript library for mobile-friendly interactive maps.
Leaflet has all the mapping features most developers need.
Quick start
The Leaflet web site provides a quick start tutorial.
To follow the tutorial I created an index.html page using Visual Studio Code.
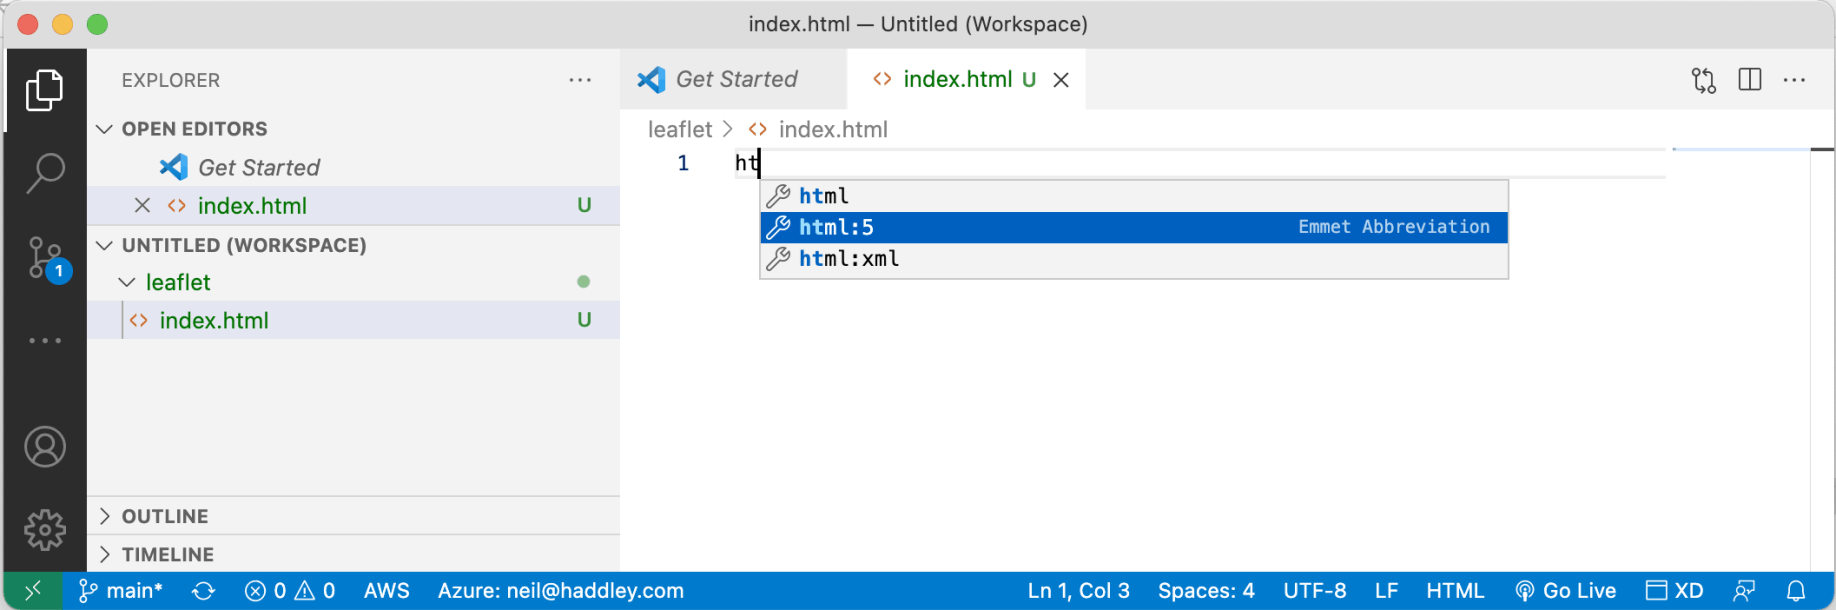
I used emmet
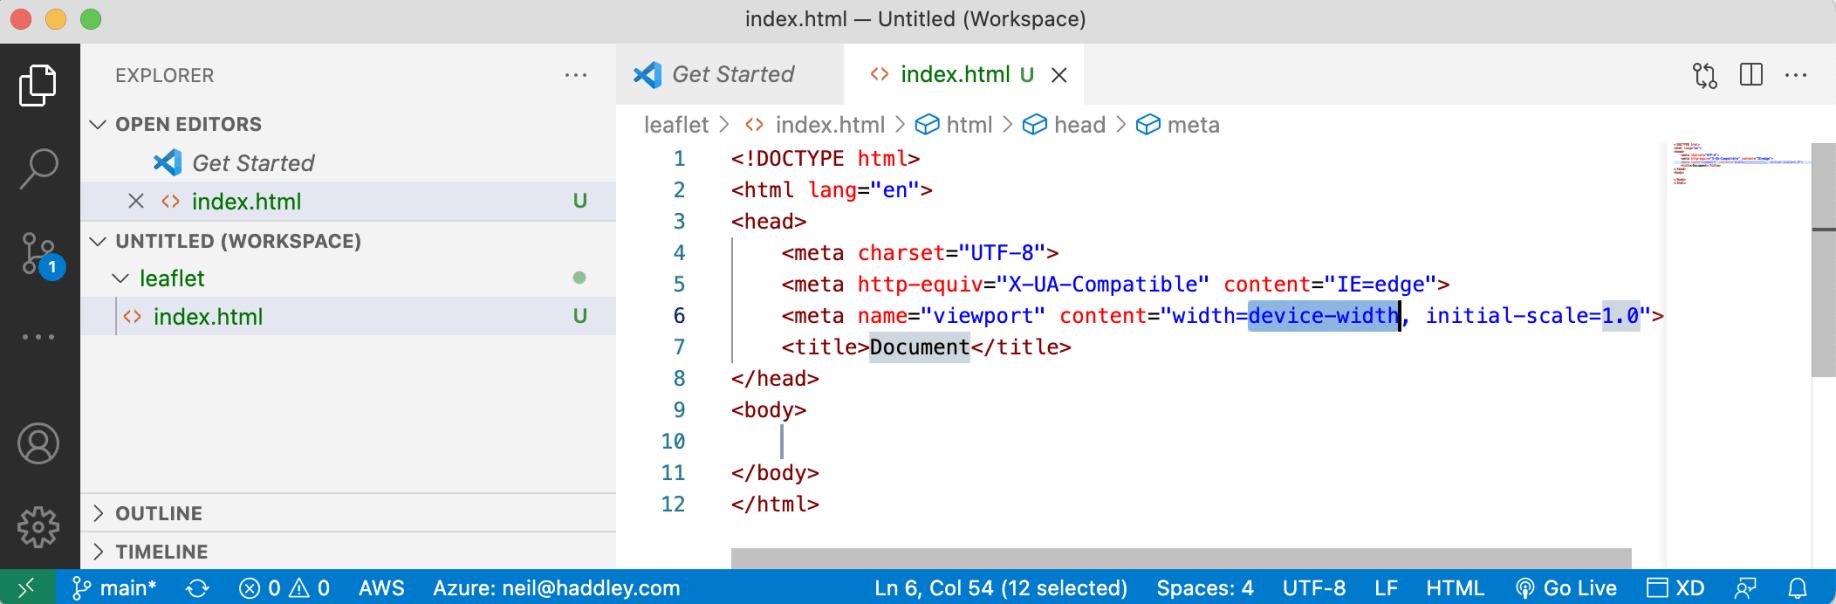
I created a template HTML page
Leaflet code
I added the leaflet css styles and javascript to create an interactive map.
The letter L is used to access Leaflet.
Here I replaced the div element with id 'map' with the Leaflet map:
JAVASCRIPT
1var map = L.map('map').setView([51.505, -0.09], 13);
Here I added the arcgisonline.com tiles:
JAVASCRIPT
1L.tileLayer('//services.arcgisonline.com/ArcGIS/rest/services/World_Imagery/MapServer/tile/{z}/{y}/{x}.jpg').addTo(map);
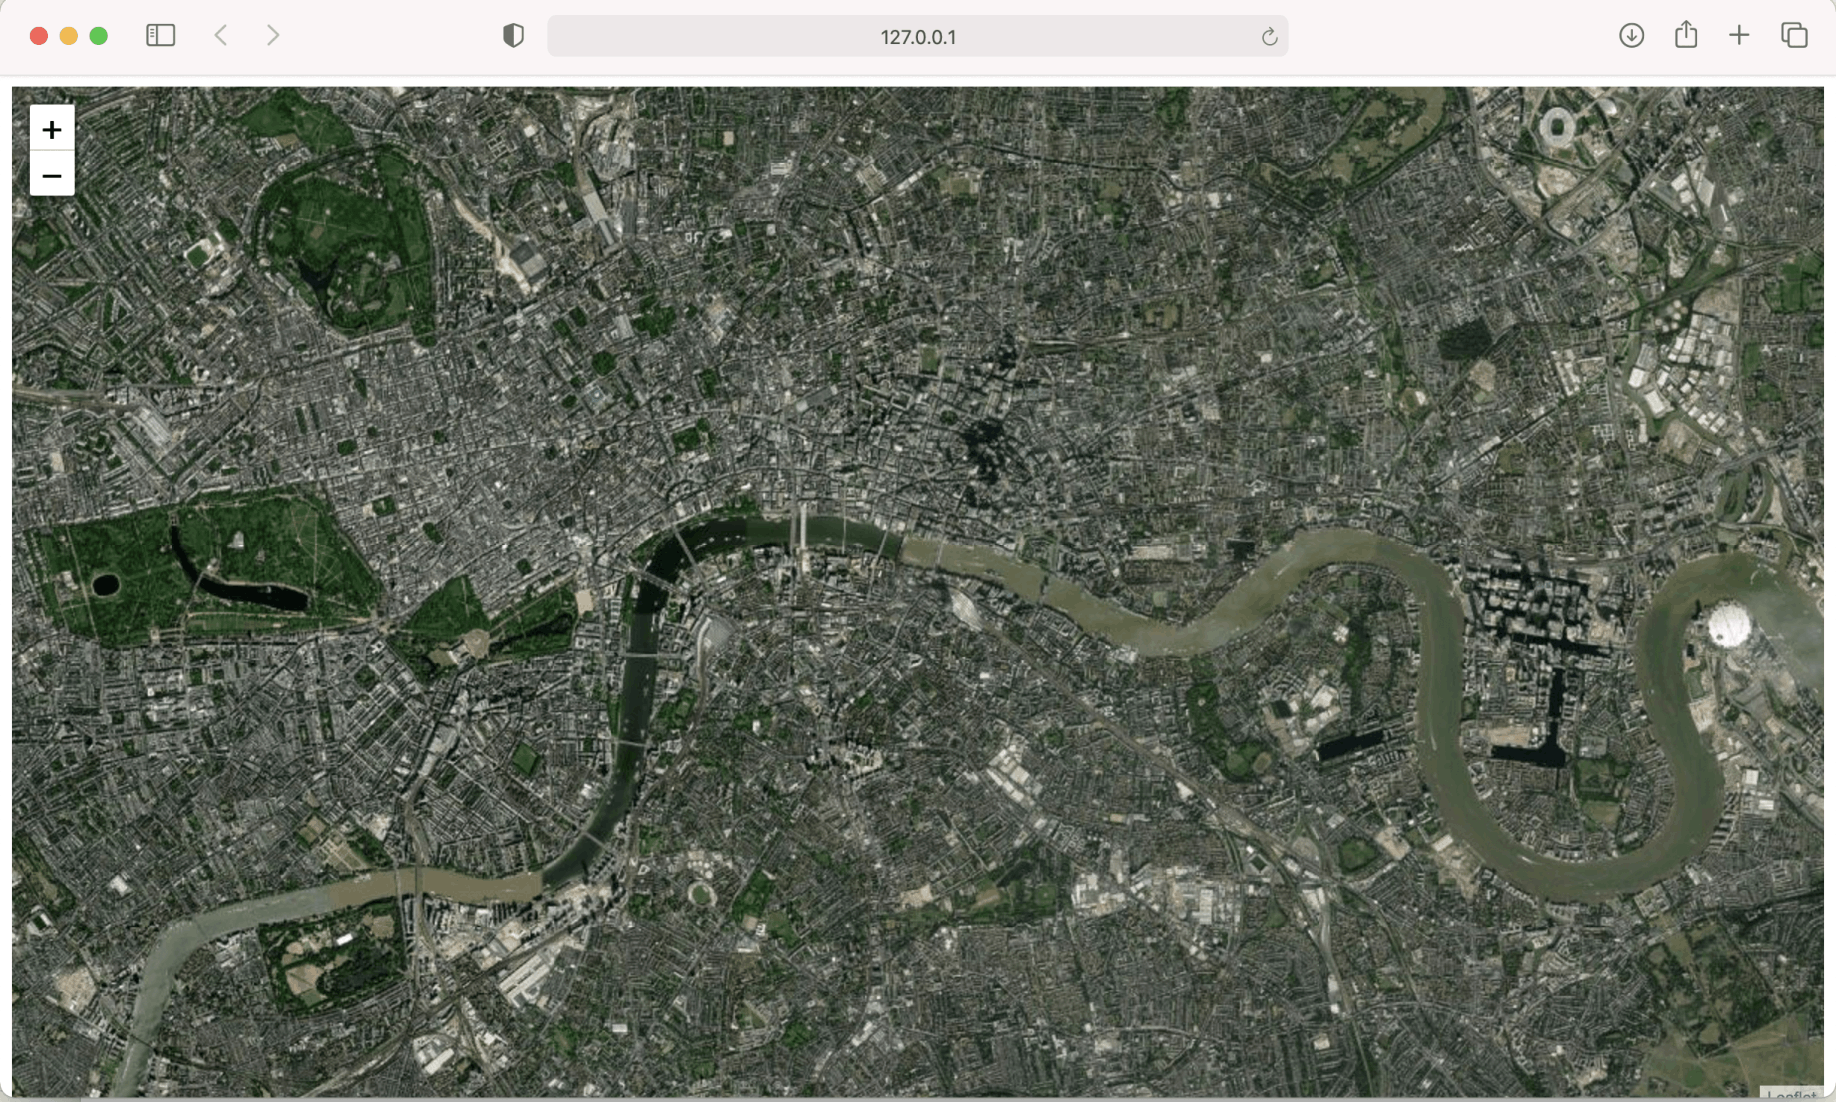
I viewed index.html from localhost
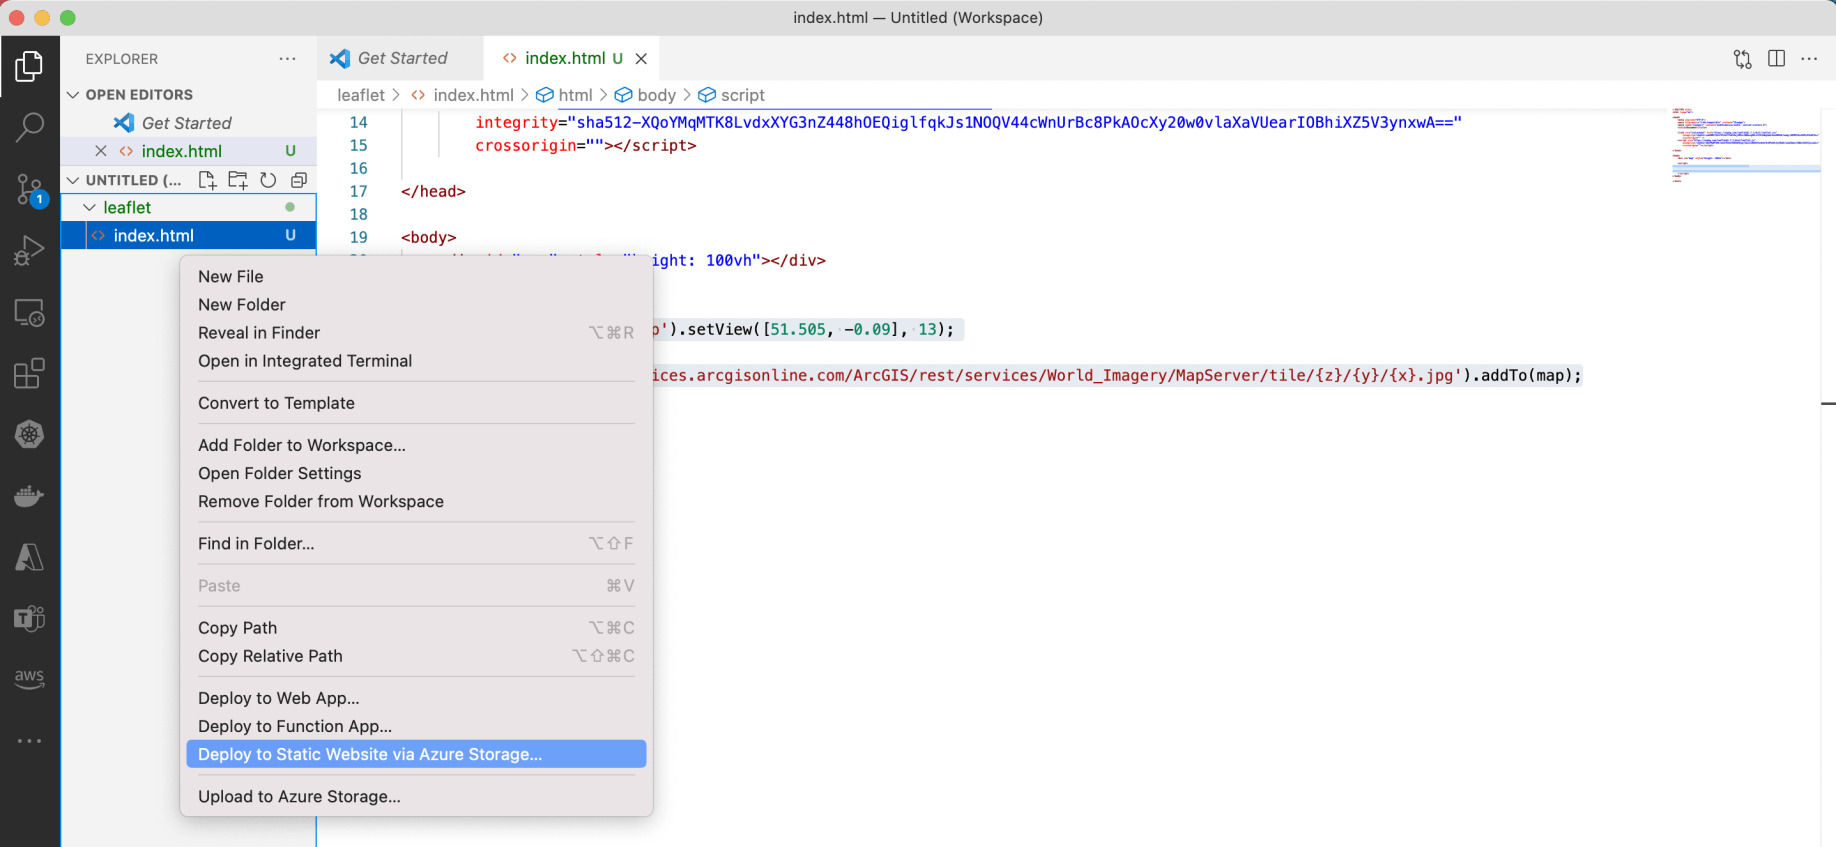
I deployed index.html to Azure Storage
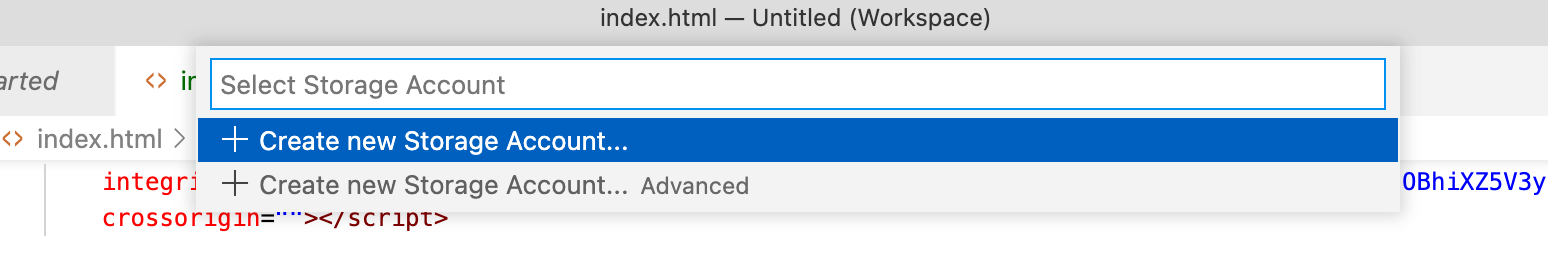
I created a new Storage Account
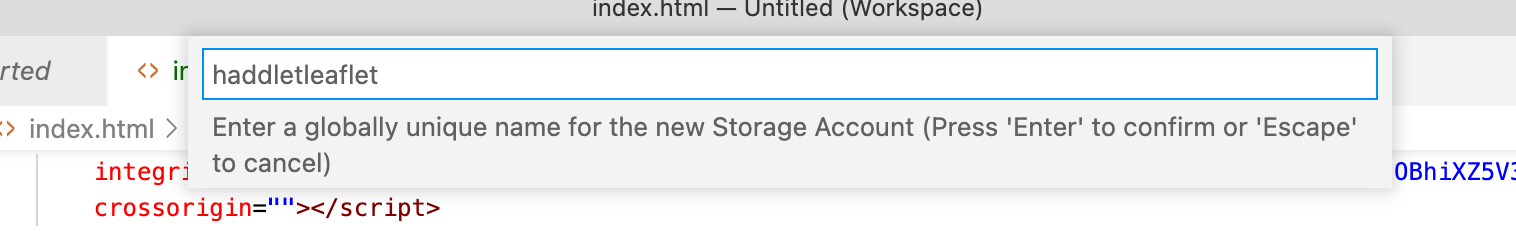
I provided a unique name
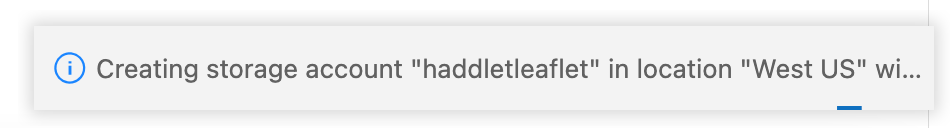
The Storage account was created
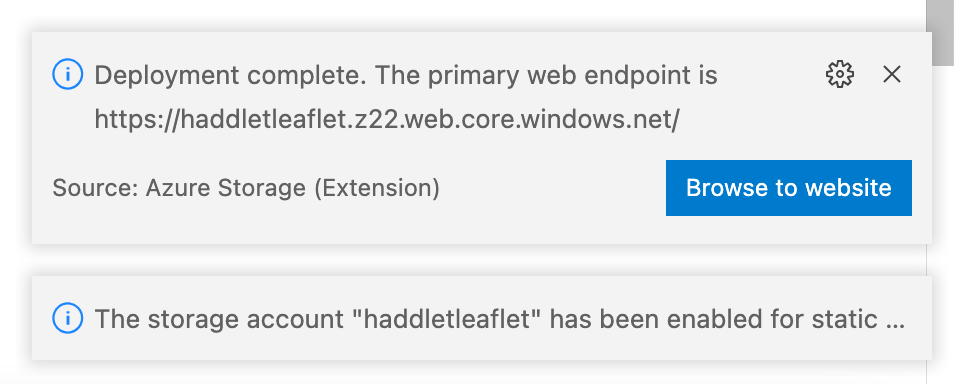
I clicked the Browse to website button
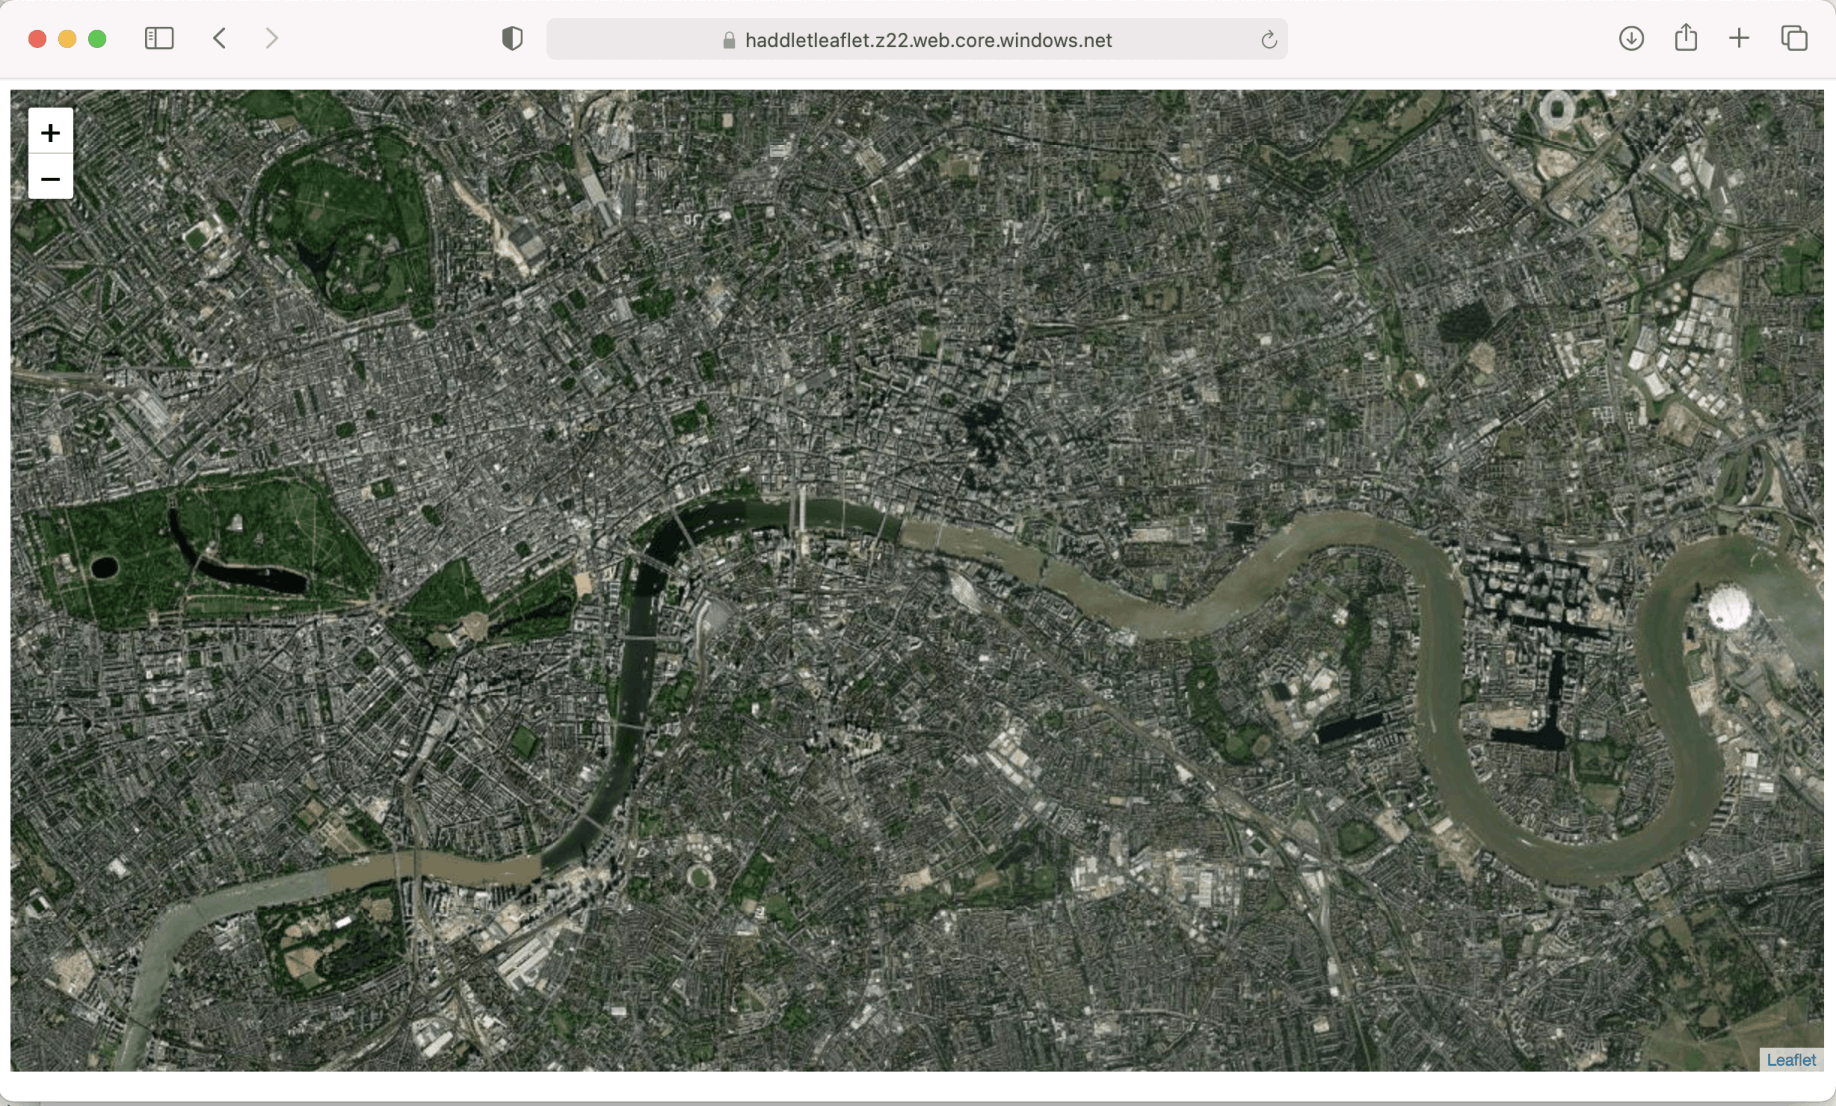
I viewed index.html from Azure on my laptop
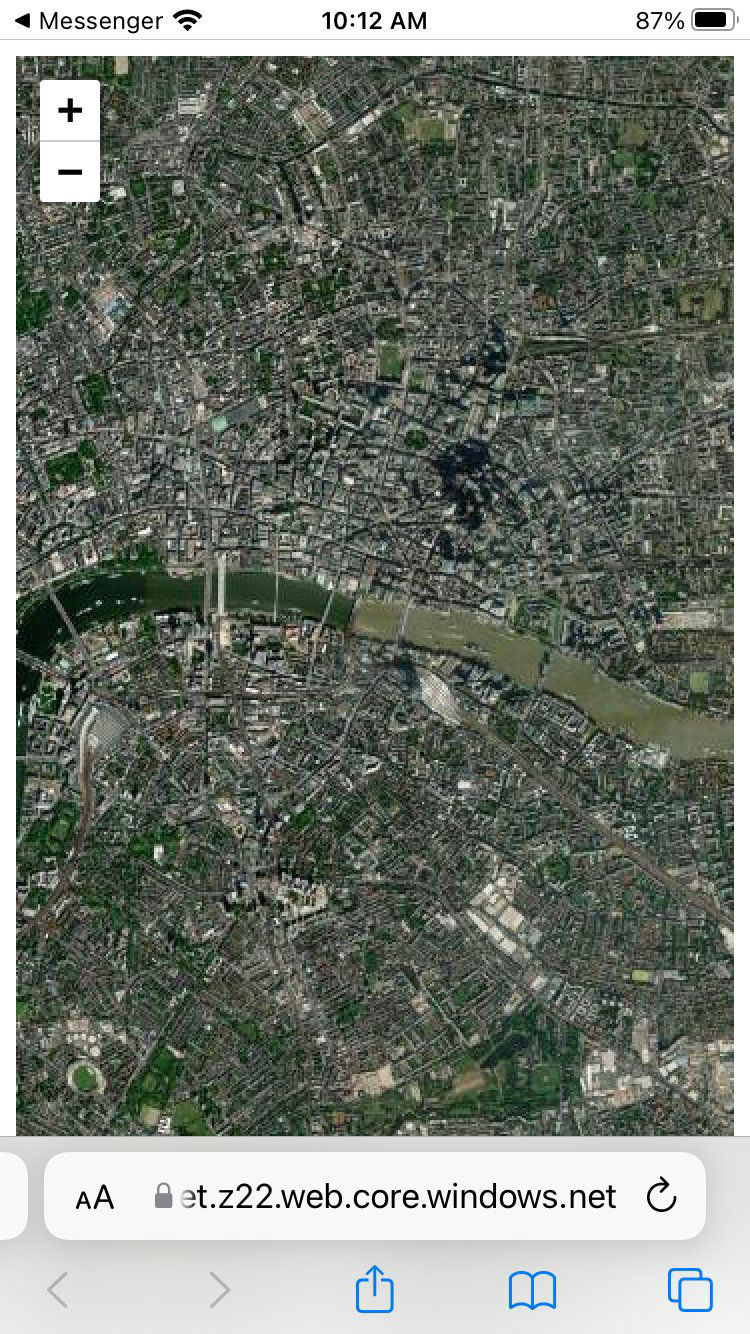
I viewed index.html from Azure on iPhone (Safari)
Tile layer
Leaflet has to determine which tiles are needed to render the map.
The tiles are downloaded from a tile server (arcgisonline.com in this case).
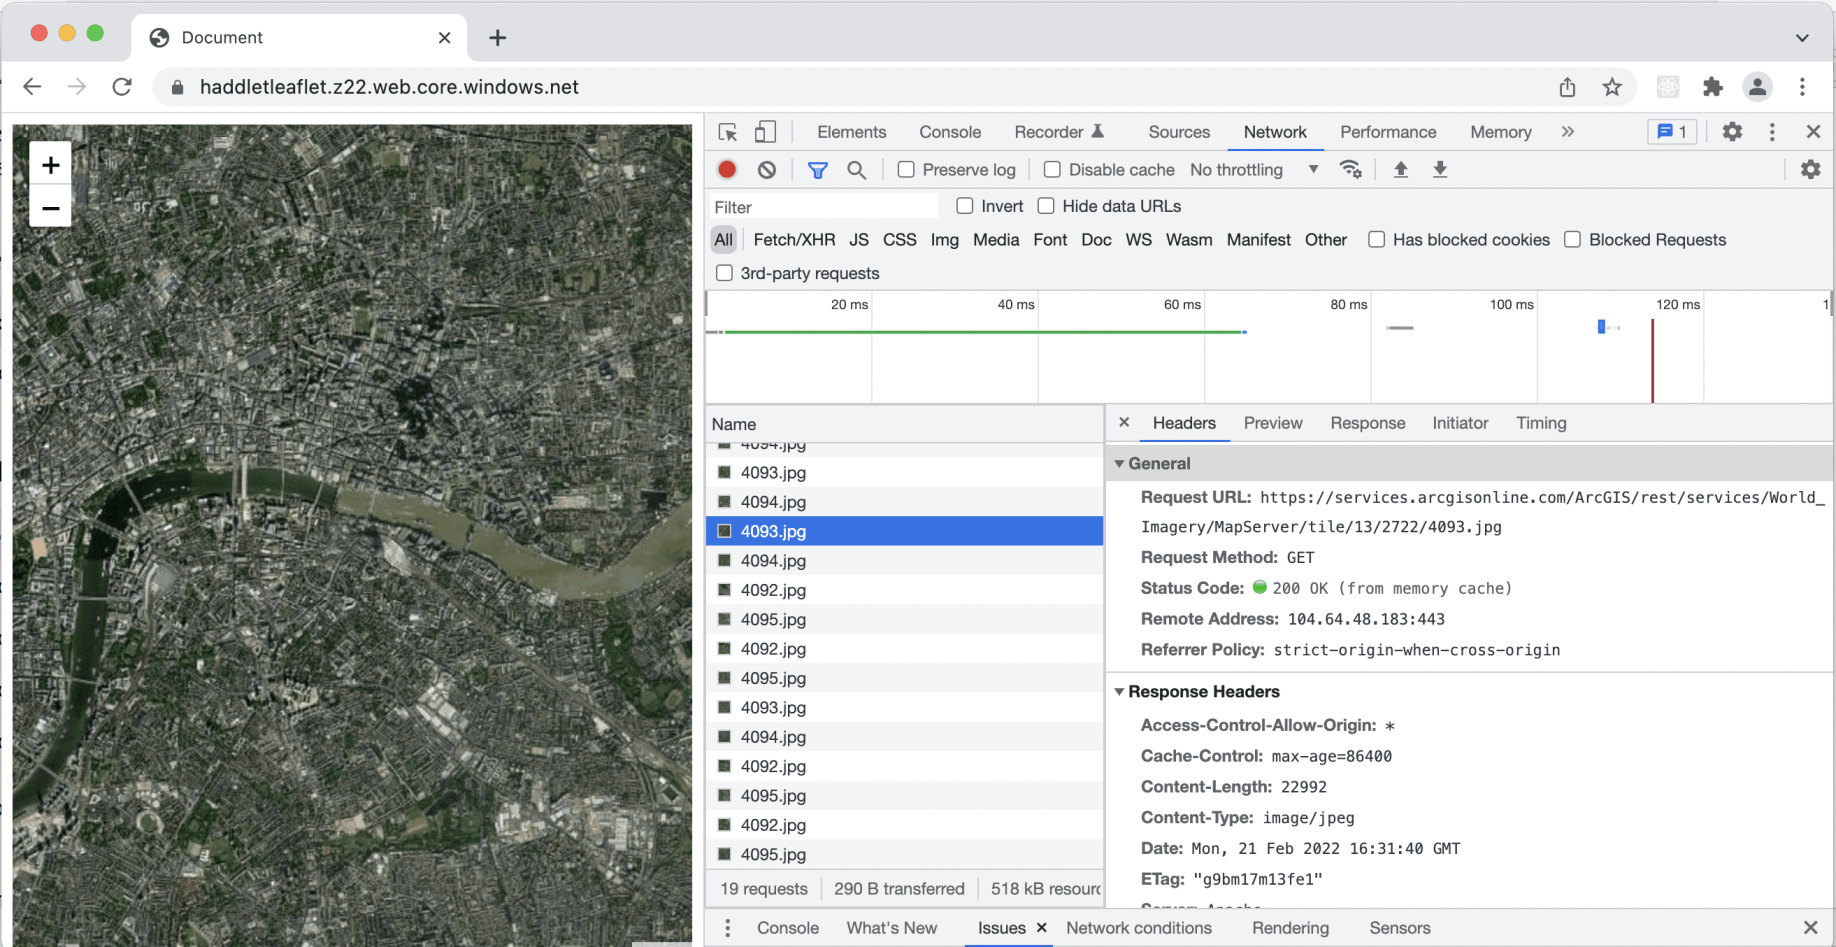
I reviewed network requests
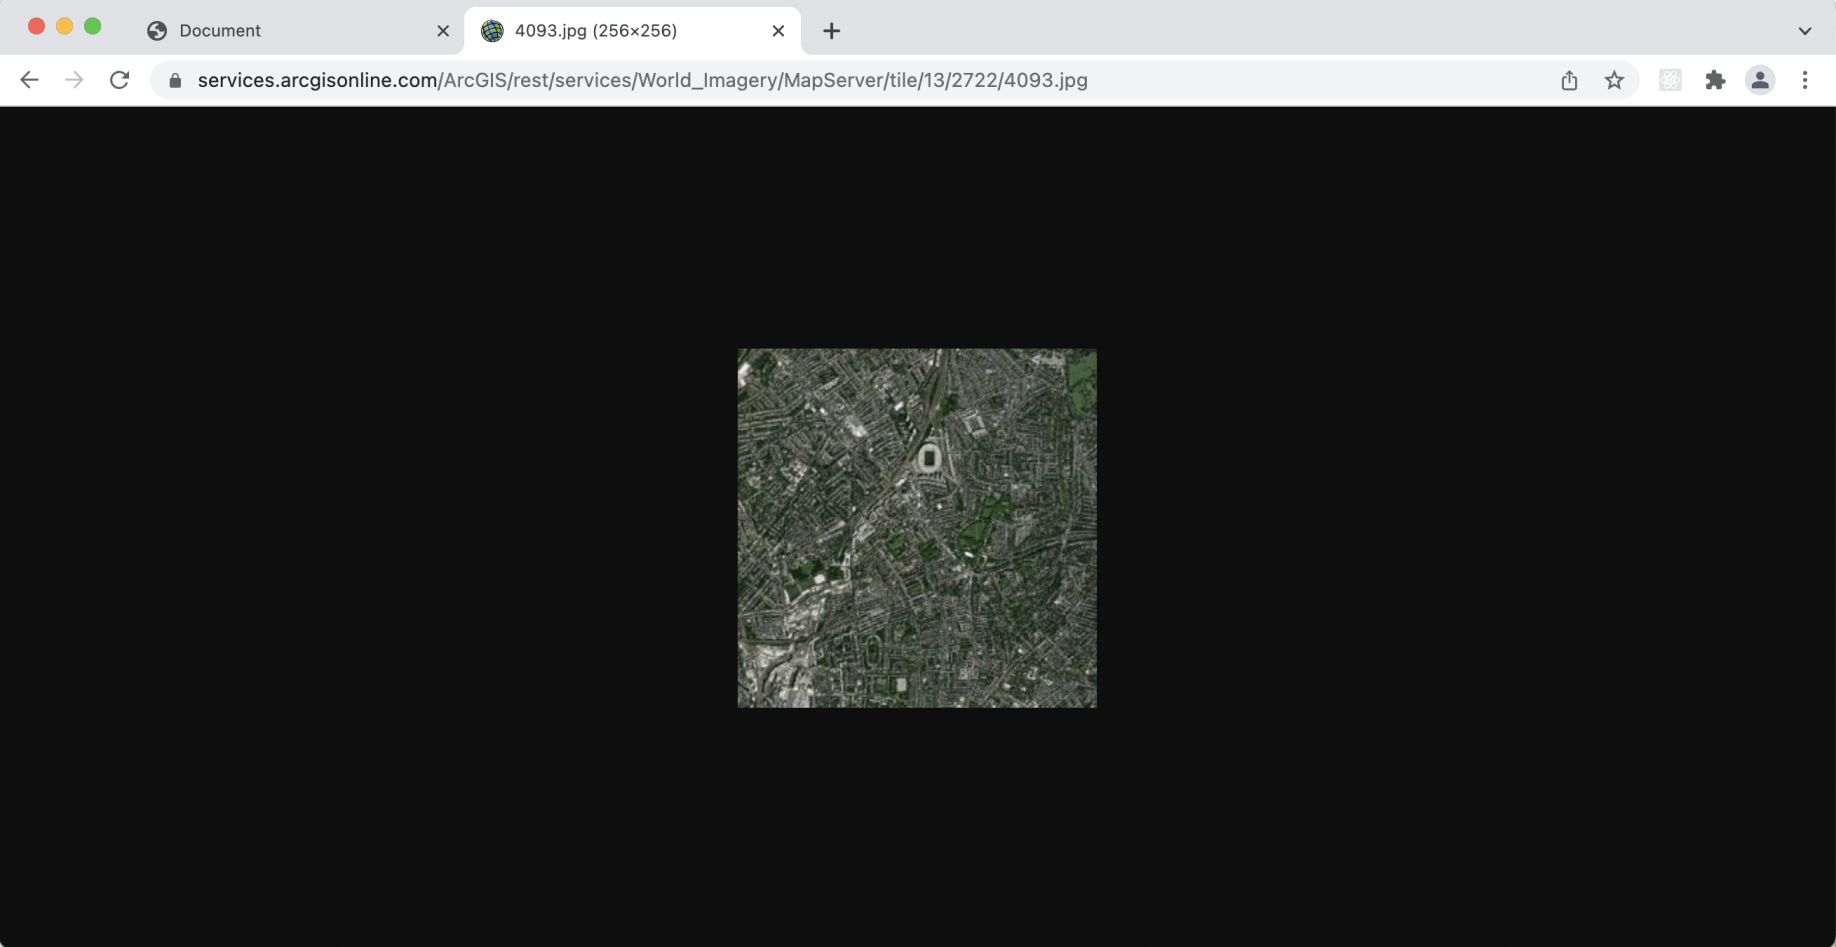
I reviewed a single tile from arcgisonline.com
Calculating a tile url
To determine which tile is needed to display a given location leaflet needs to convert from a given latitude and longitude to a given tile url.
The calculations are described here:
https://wiki.openstreetmap.org/wiki/Slippy_map_tilenames#Tile_servers
Example code:
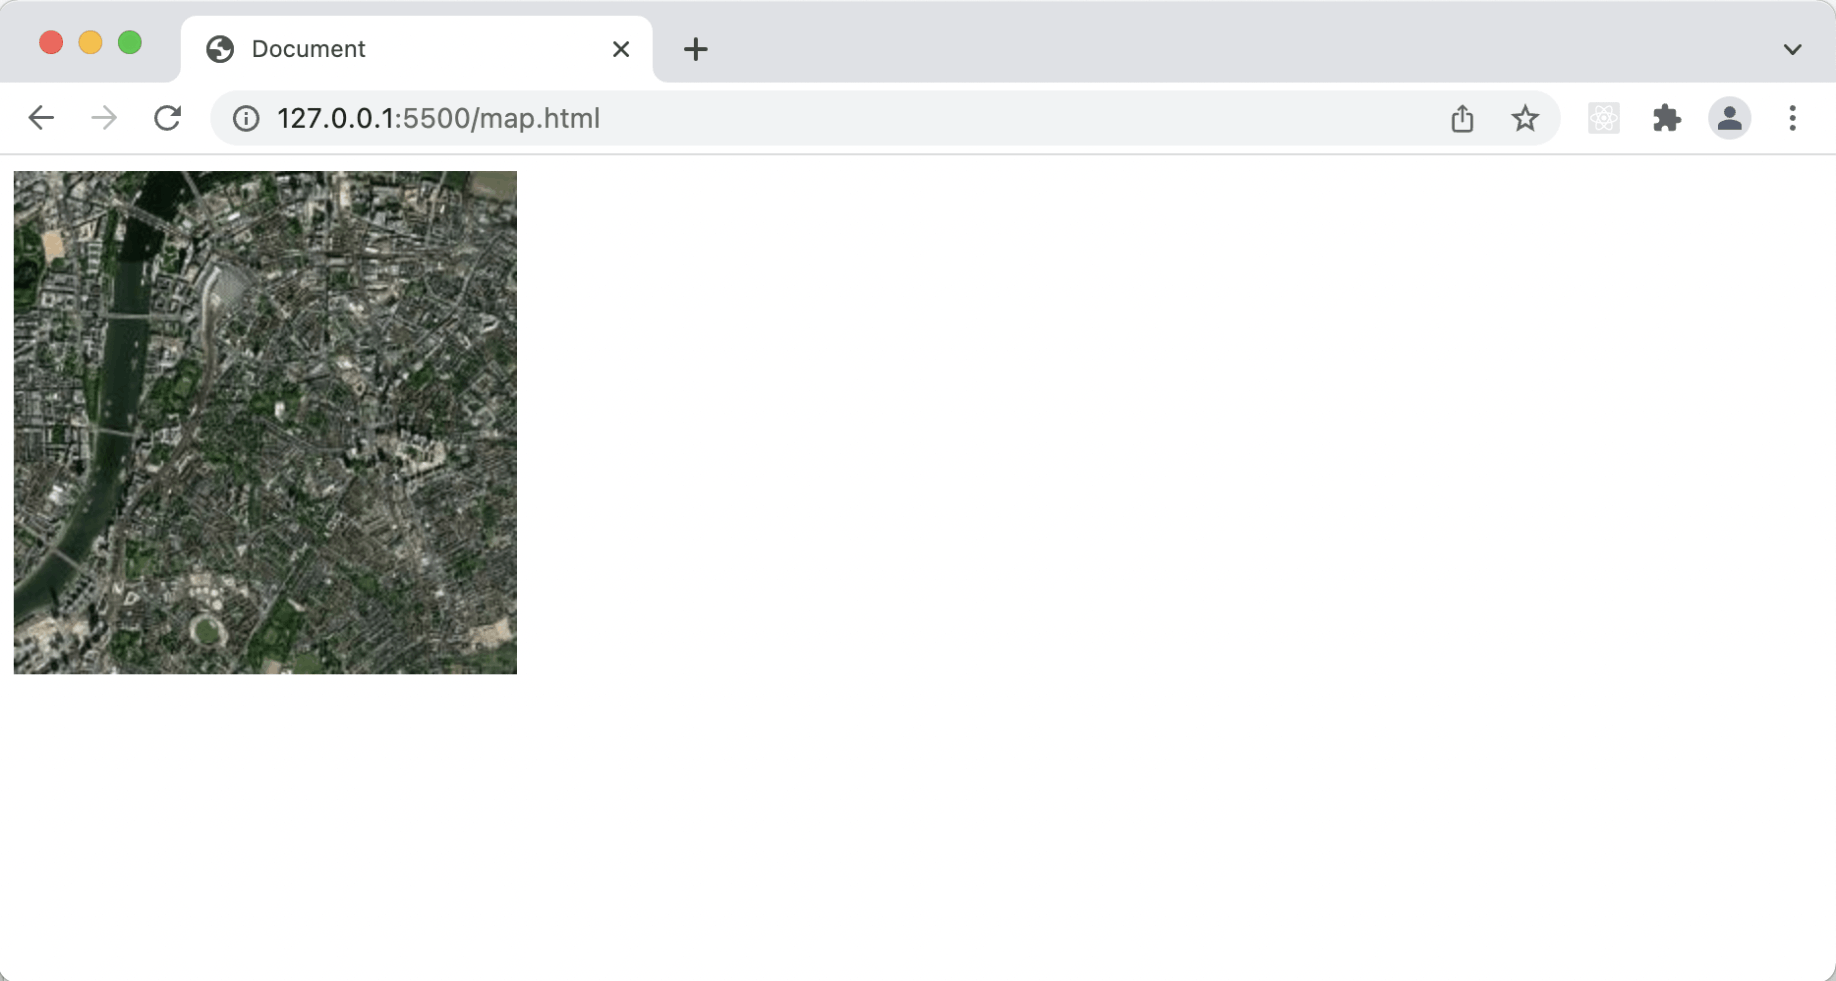
I displayed a given location
To display a given area
To determine which tiles need to be downloaded to display a given area at a given zoom level leaflet needs to convert from a pair of latitude and longitude co-ordinates to a set of tile urls.
Example code:
JAVASCRIPT
1var zoom        = 9;
2var top_tile    = lat2tile(north_edge, zoom); // eg.lat2tile(34.422, 9);
3var left_tile   = lon2tile(west_edge, zoom);
4var bottom_tile = lat2tile(south_edge, zoom);
5var right_tile  = lon2tile(east_edge, zoom);
6var width       = Math.abs(left_tile - right_tile) + 1;
7var height      = Math.abs(top_tile - bottom_tile) + 1;
8
9// total tiles
10var total_tiles = width * height; // -> eg. 377
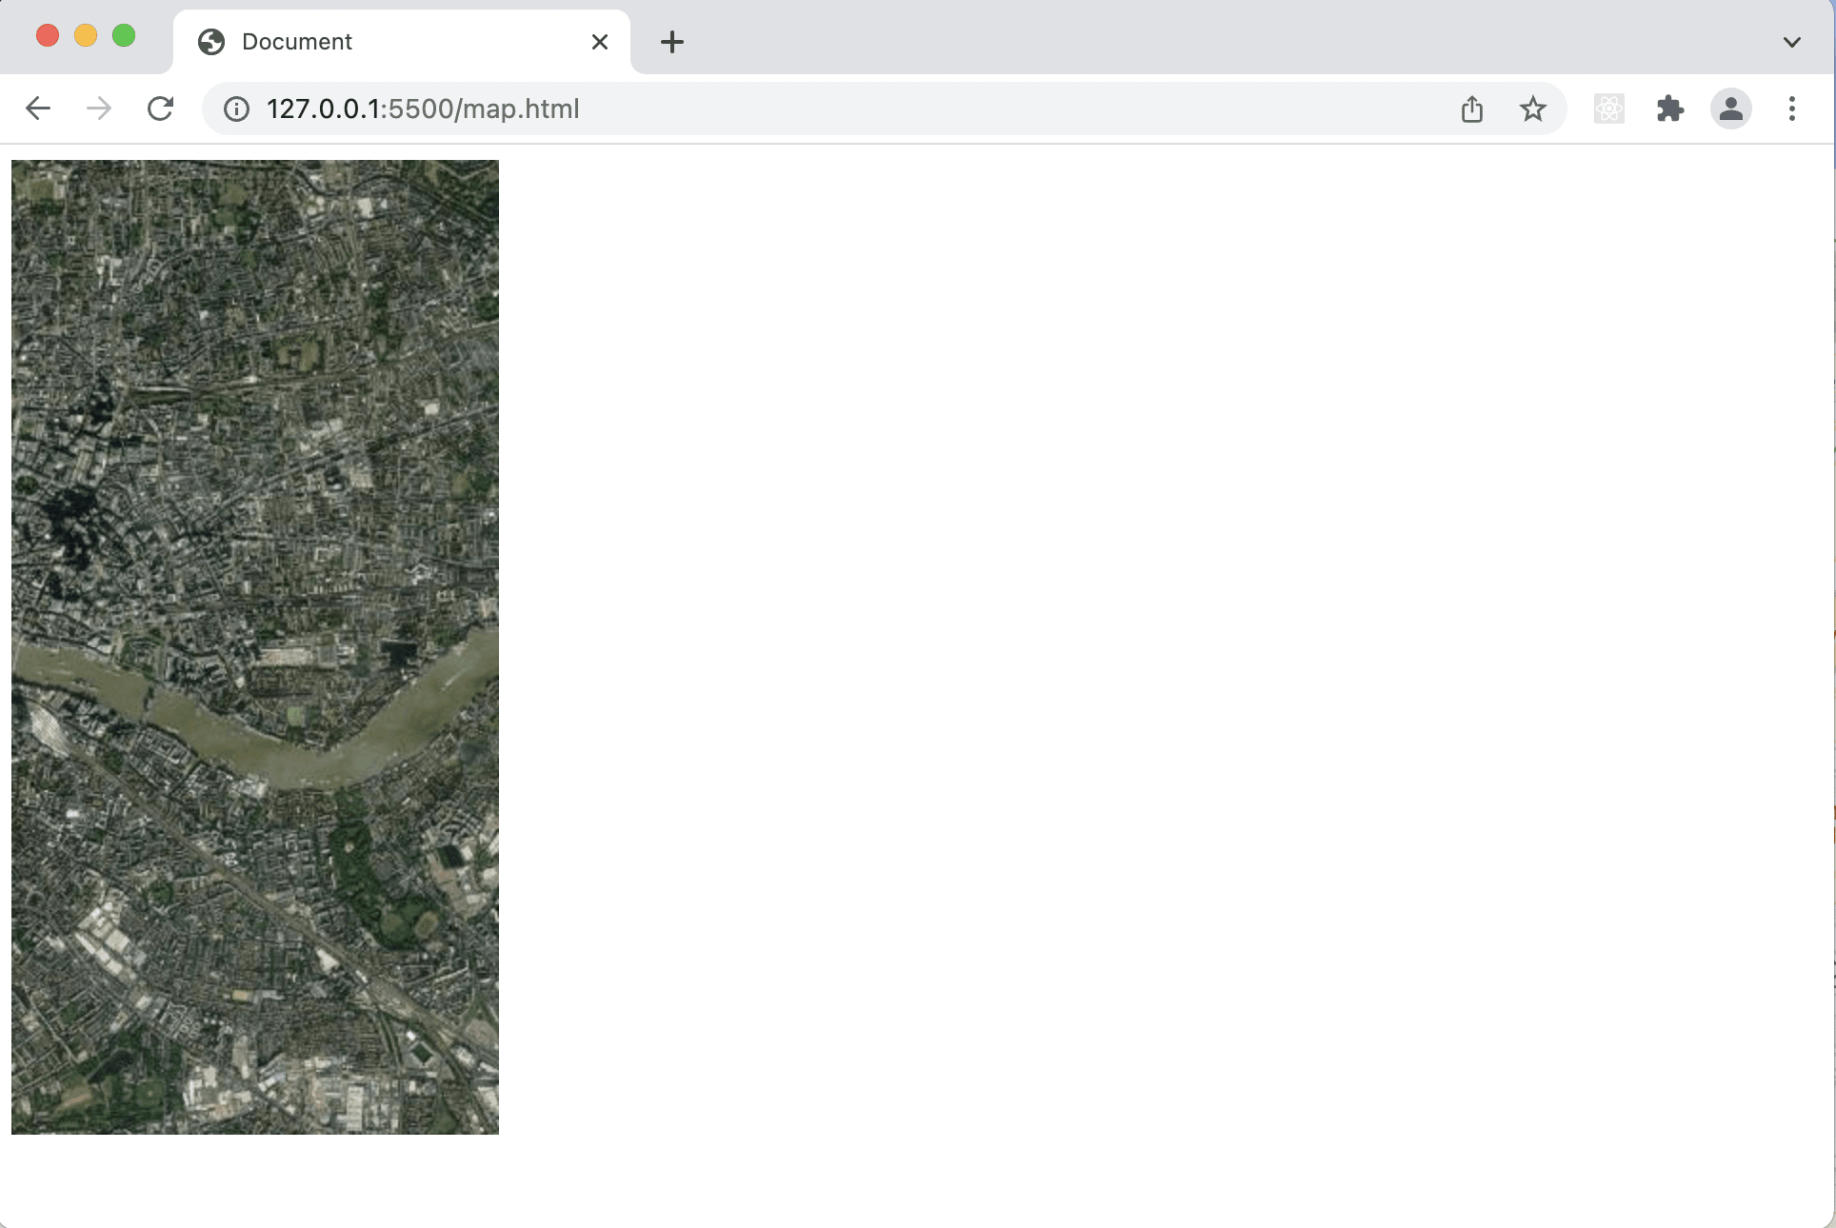
I displayed a given area
Leaflet can be used to add shapes and markers to a map
I added a triangle to a Leaflet map using this code:
JAVASCRIPT
1var polygon = L.polygon([
2            [51.509, -0.08],
3            [51.503, -0.06],
4            [51.51, -0.047]
5        ]).addTo(map);
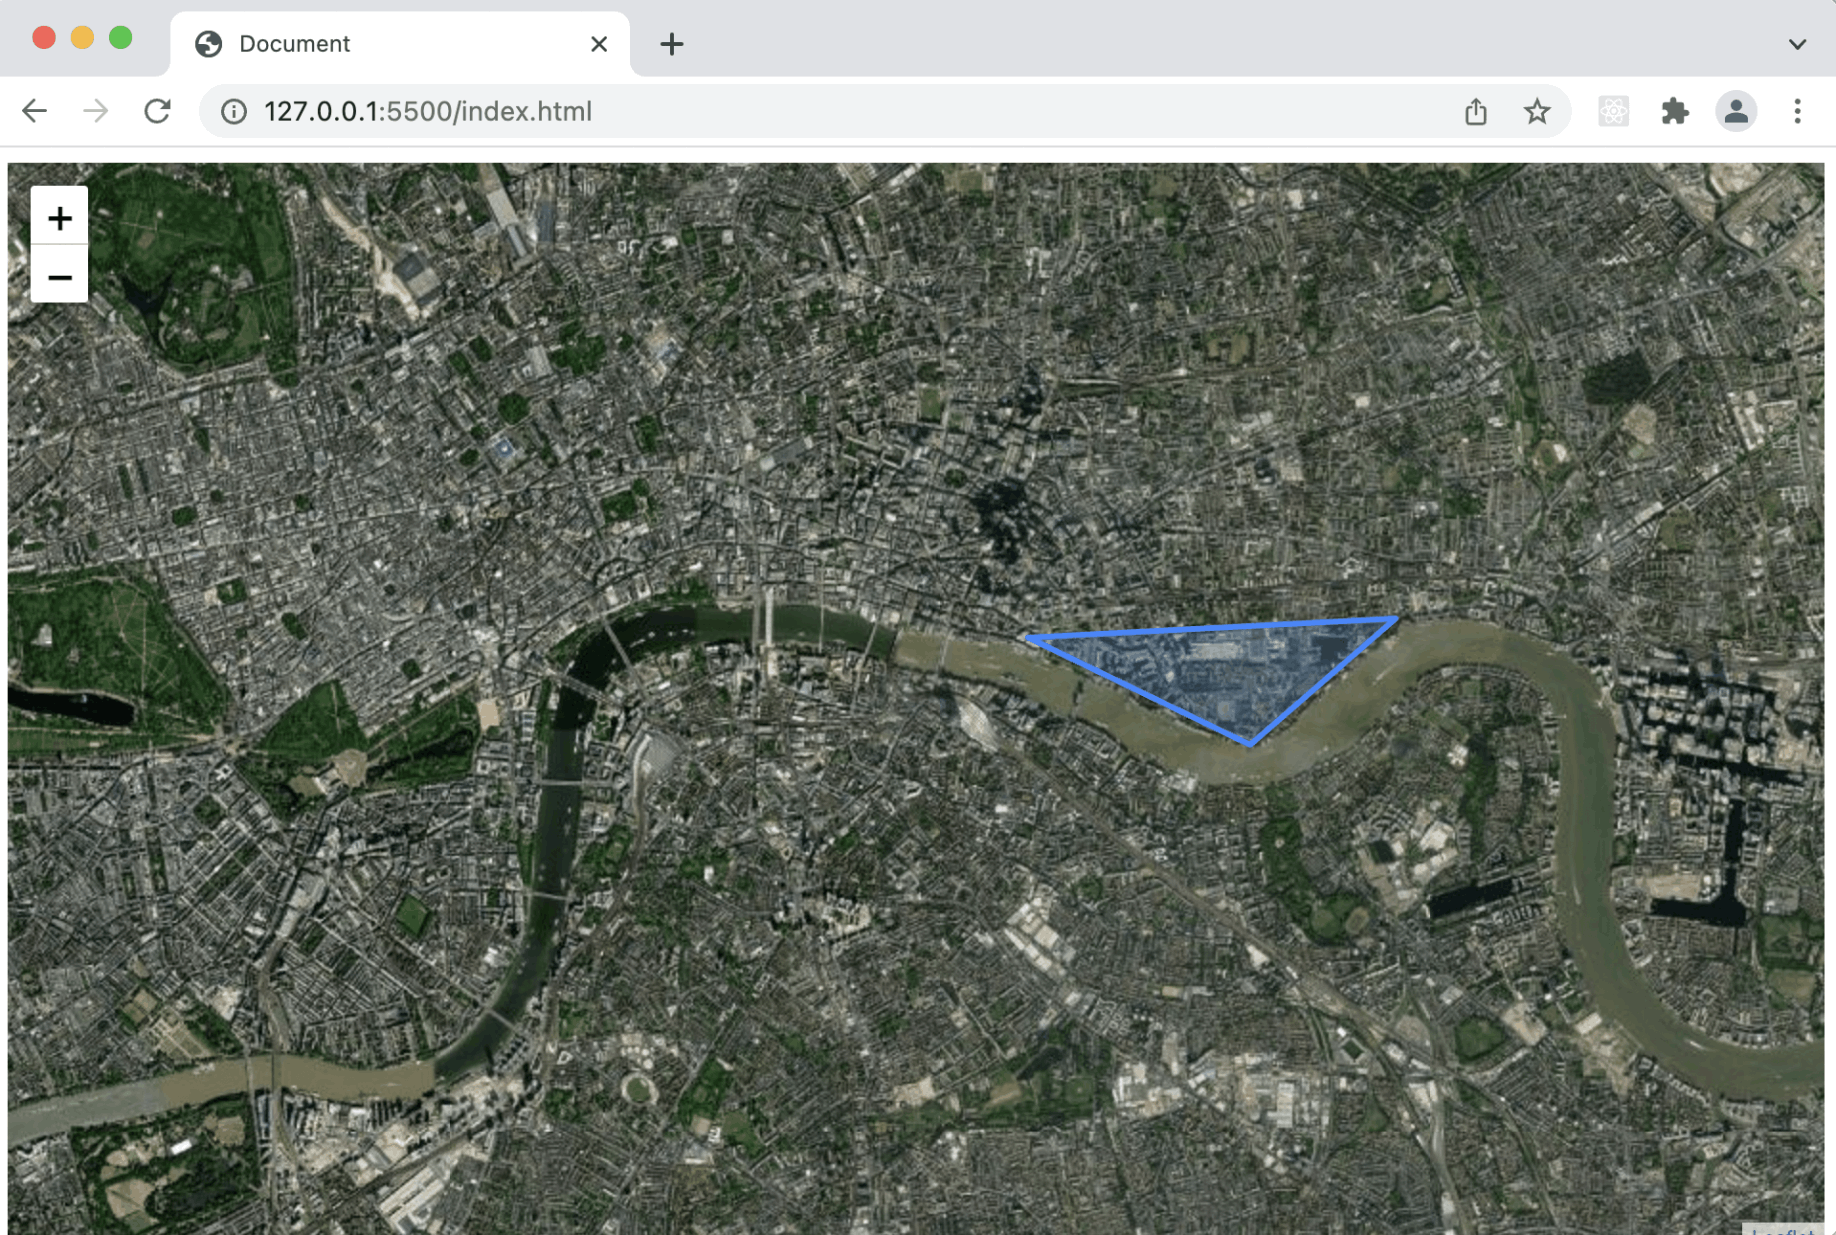
I added a triangle to a Leaflet map
Leaflet controls can be added to a map
A number of controls are included with Leaflet.
I used this code to add a scale control to a map:
JAVASCRIPT
1L.control.scale().addTo(map);
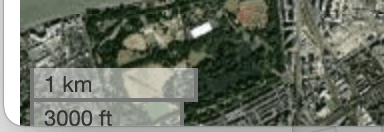
I added a scale control
Creating new controls
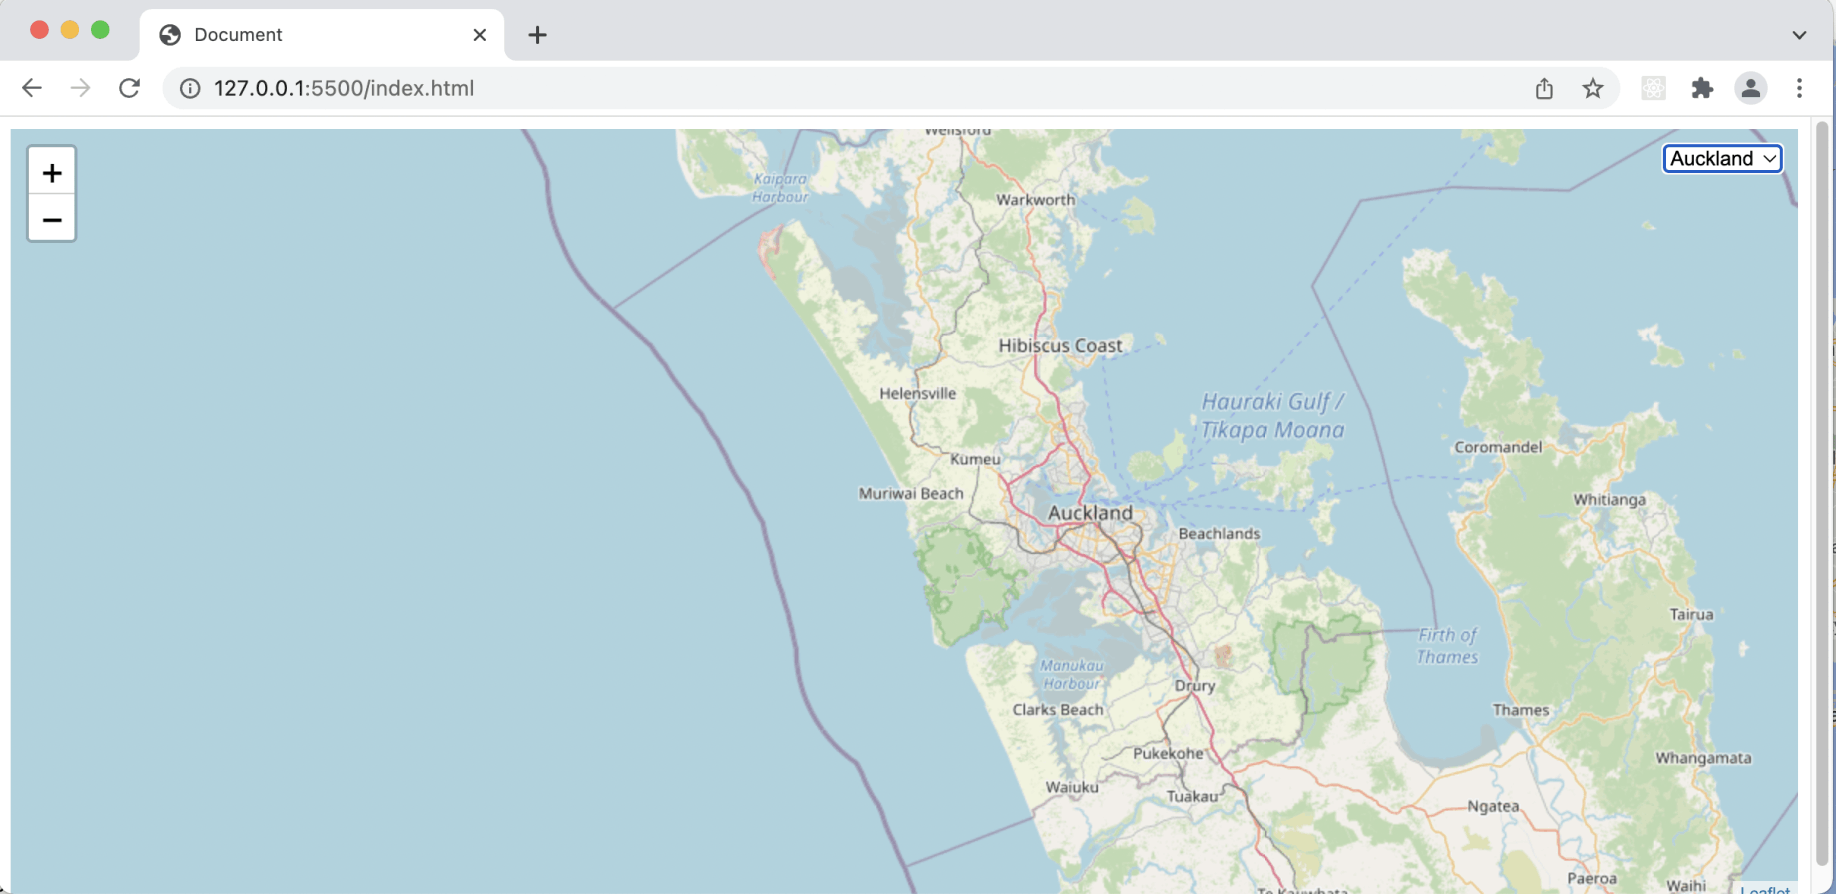
I created a travel by map control
index.html
HTML
1<!DOCTYPE html>
2<html lang="en">
3<head>
4    <meta charset="UTF-8">
5    <meta http-equiv="X-UA-Compatible" content="IE=edge">
6    <meta name="viewport" content="width=device-width, initial-scale=1.0">
7    <title>Document</title>
8</head>
9<body>
10
11</body>
12</html>
index.html
HTML
1<!DOCTYPE html>
2<html lang="en">
3
4<head>
5    <meta charset="UTF-8">
6    <meta http-equiv="X-UA-Compatible" content="IE=edge">
7    <meta name="viewport" content="width=device-width, initial-scale=1.0">
8    <title>Document</title>
9
10    <link rel="stylesheet" href="https://unpkg.com/leaflet@1.7.1/dist/leaflet.css"
11        integrity="sha512-xodZBNTC5n17Xt2atTPuE1HxjVMSvLVW9ocqUKLsCC5CXdbqCmblAshOMAS6/keqq/sMZMZ19scR4PsZChSR7A=="
12        crossorigin="" />
13    <script src="https://unpkg.com/leaflet@1.7.1/dist/leaflet.js"
14        integrity="sha512-XQoYMqMTK8LvdxXYG3nZ448hOEQiglfqkJs1NOQV44cWnUrBc8PkAOcXy20w0vlaXaVUearIOBhiXZ5V3ynxwA=="
15        crossorigin=""></script>
16
17</head>
18
19<body>
20    <div id="map" style="height: 100vh"></div>
21
22    <script>
23        var map = L.map('map').setView([51.505, -0.09], 13);
24
25        L.tileLayer('//services.arcgisonline.com/ArcGIS/rest/services/World_Imagery/MapServer/tile/{z}/{y}/{x}.jpg').addTo(map);
26    </script>
27</body>
28
29</html>
map.html
HTML
1<!DOCTYPE html>
2<html lang="en">
3
4<head>
5    <meta charset="UTF-8">
6    <meta http-equiv="X-UA-Compatible" content="IE=edge">
7    <meta name="viewport" content="width=device-width, initial-scale=1.0">
8    <title>Document</title>
9
10    <script>
11        function lon2tile(lon, zoom) { return (Math.floor((lon + 180) / 360 * Math.pow(2, zoom))); }
12        function lat2tile(lat, zoom) { return (Math.floor((1 - Math.log(Math.tan(lat * Math.PI / 180) + 1 / Math.cos(lat * Math.PI / 180)) / Math.PI) / 2 * Math.pow(2, zoom))); }
13    </script>
14</head>
15
16<body>
17    <img id="tile">
18
19    <script>
20        const latlng = [51.505, -0.09]
21        const zoom = 13
22
23        const z = zoom
24        y = lat2tile(latlng[0], zoom)
25        x = lon2tile(latlng[1], zoom)
26
27        const url = `https://services.arcgisonline.com/ArcGIS/rest/services/World_Imagery/MapServer/tile/${z}/${y}/${x}.jpg`
28        document.getElementById("tile").src = url
29    </script>
30</body>
31
32</html>
map.html
HTML
1<!DOCTYPE html>
2<html lang="en">
3
4<head>
5    <meta charset="UTF-8">
6    <meta http-equiv="X-UA-Compatible" content="IE=edge">
7    <meta name="viewport" content="width=device-width, initial-scale=1.0">
8    <title>Document</title>
9
10    <script>
11        function lon2tile(lon, zoom) { return (Math.floor((lon + 180) / 360 * Math.pow(2, zoom))); }
12        function lat2tile(lat, zoom) { return (Math.floor((1 - Math.log(Math.tan(lat * Math.PI / 180) + 1 / Math.cos(lat * Math.PI / 180)) / Math.PI) / 2 * Math.pow(2, zoom))); }
13    </script>
14</head>
15
16<body>
17    <div id="map" style="position: relative;">
18
19        <script>
20
21            // [HOW FAR NORTH, HOW FAR WEST]
22            const latlngnorthwest = [51.51, -0.08]
23            const latlngsoutheast = [51.503, -0.047]
24
25            const zoom = 13
26
27            const north_edge = latlngnorthwest[0]
28            const west_edge = latlngnorthwest[1]
29            const south_edge = latlngsoutheast[0]
30            const east_edge = latlngsoutheast[1]
31
32            const top_tile = lat2tile(north_edge, zoom);
33            const left_tile = lon2tile(west_edge, zoom);
34            const bottom_tile = lat2tile(south_edge, zoom);
35            const right_tile = lon2tile(east_edge, zoom);
36
37            console.log({ top_tile, left_tile, bottom_tile, right_tile })
38
39            const width = Math.abs(left_tile - right_tile) + 1;
40            const height = Math.abs(top_tile - bottom_tile) + 1;
41
42            const total_tiles = width * height; // -> eg. 377
43
44            console.log({ width, height, total_tiles })
45
46            const tileSize = 256
47
48            document.getElementById("map").style.width = tileSize * width + "px";
49            document.getElementById("map").style.height = tileSize * height + "px";
50
51            let innerHTML = ""
52
53            for (let top = 0; top < height; top++) {
54                for (let left = 0; left < width; left++) {
55                    toptobottom = top_tile + top
56                    lefttoright = left_tile + left
57
58                    innerHTML += `<img style="position:absolute;top:${top * tileSize}px;left:${left * tileSize}px;height:${tileSize}px;width:${tileSize}px" src=https://services.arcgisonline.com/ArcGIS/rest/services/World_Imagery/MapServer/tile/${zoom}/${toptobottom}/${lefttoright}.jpg>`
59                }
60            }
61            document.getElementById("map").innerHTML = innerHTML
62
63        </script>
64</body>
65
66</html>
index.html
HTML
1<!DOCTYPE html>
2<html lang="en">
3
4<head>
5    <meta charset="UTF-8">
6    <meta http-equiv="X-UA-Compatible" content="IE=edge">
7    <meta name="viewport" content="width=device-width, initial-scale=1.0">
8    <title>Document</title>
9
10    <link rel="stylesheet" href="https://unpkg.com/leaflet@1.7.1/dist/leaflet.css"
11        integrity="sha512-xodZBNTC5n17Xt2atTPuE1HxjVMSvLVW9ocqUKLsCC5CXdbqCmblAshOMAS6/keqq/sMZMZ19scR4PsZChSR7A=="
12        crossorigin="" />
13    <script src="https://unpkg.com/leaflet@1.7.1/dist/leaflet.js"
14        integrity="sha512-XQoYMqMTK8LvdxXYG3nZ448hOEQiglfqkJs1NOQV44cWnUrBc8PkAOcXy20w0vlaXaVUearIOBhiXZ5V3ynxwA=="
15        crossorigin=""></script>
16
17</head>
18
19<body>
20    <div id="map" style="height: 100vh"></div>
21
22    <script>
23        var map = L.map('map').setView([51.505, -0.09], 13);
24
25        L.tileLayer('//services.arcgisonline.com/ArcGIS/rest/services/World_Imagery/MapServer/tile/{z}/{y}/{x}.jpg').addTo(map);
26
27        var polygon = L.polygon([
28            [51.509, -0.08],
29            [51.503, -0.06],
30            [51.51, -0.047]
31        ]).addTo(map);
32
33    </script>
34</body>
35
36</html>
index.html
HTML
1<!DOCTYPE html>
2<html lang="en">
3
4<head>
5    <meta charset="UTF-8">
6    <meta http-equiv="X-UA-Compatible" content="IE=edge">
7    <meta name="viewport" content="width=device-width, initial-scale=1.0">
8    <title>Document</title>
9
10    <link rel="stylesheet" href="https://unpkg.com/leaflet@1.7.1/dist/leaflet.css"
11        integrity="sha512-xodZBNTC5n17Xt2atTPuE1HxjVMSvLVW9ocqUKLsCC5CXdbqCmblAshOMAS6/keqq/sMZMZ19scR4PsZChSR7A=="
12        crossorigin="" />
13    <script src="https://unpkg.com/leaflet@1.7.1/dist/leaflet.js"
14        integrity="sha512-XQoYMqMTK8LvdxXYG3nZ448hOEQiglfqkJs1NOQV44cWnUrBc8PkAOcXy20w0vlaXaVUearIOBhiXZ5V3ynxwA=="
15        crossorigin=""></script>
16
17</head>
18
19<body>
20    <div id="map" style="height: 100vh"></div>
21
22    <script>
23
24        L.LocationSelect = L.Control.extend({
25            options: {
26                position: 'topright',
27                locations: []
28            },
29            onAdd: function (map) {
30                this.div = L.DomUtil.create('div', 'leaflet-siteselect-container');
31                this.select = L.DomUtil.create('select', 'leaflet-siteselect', this.div);
32                var content = '';
33
34                var locationKeys = Object.keys(this.options.locations)
35                for (let key in locationKeys) {
36                    content += '<option>' + locationKeys[key] + '</option>';
37                }
38
39                this.select.innerHTML = content;
40                this.select.onmousedown = L.DomEvent.stopPropagation;
41                return this.div;
42            },
43
44            on: function (type, handler) {
45                if (type == 'change') {
46                    this.onChange = handler;
47                    L.DomEvent.addListener(this.select, 'change', this._onChange, this);
48                } else if (type == 'click') { //don't need this here probably, but for convenience?
49                    this.onClick = handler;
50                    L.DomEvent.addListener(this.select, 'click', this.onClick, this);
51                } else {
52                    console.log('LocationSelect - cannot handle ' + type + ' events.')
53                }
54            },
55
56            _onChange: function (e) {
57                var selectedLocation = this.select.options[this.select.selectedIndex].value;
58                e.details = this.options.locations[selectedLocation];
59                this.onChange(e);
60            }
61        })
62
63        L.locationSelect = function (id, options) {
64            return new L.LocationSelect(id, options);
65        }
66
67    </script>
68
69    <script>
70
71        const locations = {
72            "London": { latlng: [51.5283063, -0.3824737], zoom: 9 },
73            "Auckland": { latlng: [-36.8594804, 174.4252343], zoom: 9 },
74            "Sydney": { latlng: [-33.8473567, 150.6517868], zoom: 9 },
75            "New York": { latlng: [40.6976701, -74.2598693], zoom: 9 }
76        }
77
78        const startcity = "London"
79        var map = L.map('map').setView(locations[startcity].latlng, locations[startcity].zoom);
80
81        L.tileLayer('http://{s}.tile.openstreetmap.org/{z}/{x}/{y}.png').addTo(map);
82
83        var select = L.locationSelect({ position: 'topright', locations }).addTo(map);
84
85        select.on('change', function (e) {
86            if (e.details === undefined) {
87                return;
88            }
89            this._map.flyTo(e.details.latlng, e.details.zoom)
90        });
91
92    </script>
93</body>
94
95</html>